
RESULTS


Left: Fig. 2 Current Distribution
Right: Fig. 3 Metro Vancouver/Puget Sound Zoom
For the current distribution, Maxent utilized 1881 presence records as training samples, while a total of 11881 records were used as total presence points for creating the overall model.
All Maxent models were outputted in cloglog distribution format. Short for complementary log-log, a cloglog model is a form of generalized linear model (GLM) that follows an asymmetrical S-shaped distribution where there is a wide tail leaving 0 and a rapid ascent approaching 1. It is used where values present represent event occurrences and the number of observed events can be modeled using a Poisson distribution (Van Horn, 2015). Cloglogs work best for bivariate responses, where each value has an event either occurring or not occurring, and has been shown to demonstrate a high level of accuracy in predicting rare events (Kitali et al., 2017). Cloglog is the default Maxent output format as species distribution modelling of species presence probability follows a Poisson function.
To assess the accuracy and significance of the Maxent prediction and model, Maxent outputs a sensitivity chart (Fig. 4) to measure the area under curve (AUC) accuracy (Kalboussi and Achour, 2018). Scores below 0.5 indicate near random distribution, 0.5-0.7 indicates poor prediction accuracy, 0.7-0.9 indicates good prediction accuracy, while 0.9 and above indicate excellent prediction accuracy. Very high AUC scores for species distribution modelling tends to indicate continuous species distribution (Kalboussi and Achour, 2018). Our present-day distribution model had an AUC score of 0.918, very close to the maximum score of 0.920. This is likely attributed to our extremely large sample size; Maxent is designed to work with samples as small as 15-30 (Phillips et al, 2006), which is miniscule compared to our sample size (n=11394).

Fig. 4 Sensitivity Chart of Model and AUC Score

Fig. 5 Jackknife and Percentage Contribution Test
As described earlier on, Maxent provided a jackknifing analysis that calculates the relative importance of each variable for predicting the presence probability of rough skin newts. As shown by the analysis, Min Temp was by far the most important indicator, making up more than 50% of the total Maxent analysis, followed by Annual Mean Temp and Max Precipitation (Fig. 5). This indicates that the newts are unable to tolerate conditions below a certain temperature, which likely impacts their ability to overwinter. The jackknifing also shows that Annual Mean Temp had the highest isolated gain, meaning that it had the most useful information, even though such information did not contribute the most, making up only 33% of information contribution (Fig. 5). Meanwhile, Min Temp had the highest gain change when used in isolation as compared to when used in conjunction with other variables, which implies that it provided the most unique information that Maxent was unable to source from other environmental variable datasets. Elevation has been shown to be of little importance, which is logical as rough skin newts are known to be relatively equally distributed at a variety of elevations from sea level to 2800m (Marks and Doyle, 2020).
The maps themselves are shaded on a stretched gradient from blue to red, where blue represents a 0 on the habitat suitability scale and red represents a 1. 0 implies a completely unsuitable habitat where the species is highly unlikely to be found, while a perfect 1 means a perfect environment with extremely high presence probability. Looking at the map, presence probability is greatest along the coastlines and islands, with high concentrations around Vancouver Island and the Puget Sound areas.

Fig 6. RCP 4.5 & 8.5 Predictions for 2050 and 2070
Comparing the map of present-day distribution to the 2050 and 2070 maps using RCP 4.5 (Fig. 6 upper), there seems to be an overall increase of suitable habitat zones, with the orange area growing noticeably larger in some areas, especially on the mainland. However, while habitat zones in general seem to be growing, the overall suitability score in general seems to be lower, with less deep red zones and more orange zones appearing. There are certain exceptional areas, as shown on the zoomed in maps (Fig. 7), where the Metro Vancouver area becomes more suitable in 2050 while Vancouver Island becomes less suitable under the RCP 4.5 climate change scheme.

Fig. 7 Predictive Zooms (above)
Fig. 8 Habitat Cell Count (right)
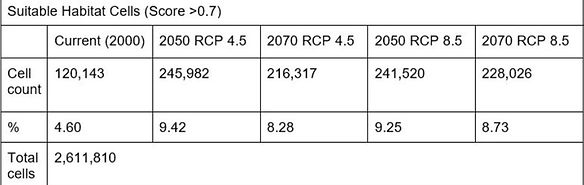
Quantitatively, we found that from the current distribution model, only 4.6% of the study area, or 120,349 raster cells, was considered to be suitable habitat zones (Fig. 8). However, under all climate change schemes, habitable zones saw drastic increases. Under the RCP 4.5 scheme, potential rough skin newt habitats rose to more than 9% in 2050, or more than 240,000 cells, an increase of more than 100%. However, this falls to just over 8% by 2070, dropping to 216,317 cells. Strangely enough, this trend remained even under the far more extreme RCP 8.5 climate model, with a slightly less intense rise in 2050, and a more gradual drop by 2070. Overall, it appears rough skin newts tend to be more receptive to warmer climates, which is supported by the minimum temperature being a key indicator for the Maxent models.
.jpg)
Fig. 9 Suitable Habitat Cells with Forest & Wetland Overlay
The Maxent models tell us the predicted habitat niche of newt in the Pacific Northwest would be doubled in 2050 due to climate change. However, the identified habitat niches are mostly located in coastal areas where human activities are high, meaning that actual usable habitat land is far more constrained (Fig. 9). Rough skin newts can only survive on land in damp forests, but forests expansion levels are questionable under climate change schemes. Many scholars have used different types of models to predict future forest fire occurrences under climate change. For example, Wotton et al. (2010) used two general circulation models (GCMs) to project future fires across Canada, and their models suggest an increase in fire occurrence of 25% by 2030 and 75% by the end of the 21st century. Although we cannot conclude that forest cover will decline in the near future due to potentially more frequent forest fires, it will be more challenging to assume that forest cover will increase in the next few decades. In our hypothesis, we assume the forest cover will not change in the next half-century, which might be the best possible scenario.
Using the land cover data from the USGS to improve our Maxent results, we calculated the number of Maxent pixels (>0.7) that overlap with our selected types of forest covers to create an improved Maxent raster, and compared the results over our three time periods in Washington and Oregon.
As the table suggests, in our original Maxent model, the pixels that represent newt habitat niches in Washington and Oregon have increased 34.72% from 2000 to 2050. However, after we excluded land cover classes such as urban areas and barren lands, the increase in pixel number dropped to 11.11% (Fig. 10), far less than the overall 100% increase suggested by the Maxent model. This finding indicates that our raw Maxent models are not telling the full story, and that the potential expansion of newt habitats may not be as optimistic as the original numbers suggested. Further studies are required to improve this model.

Fig 10. Habitat Pixel Increase in US States